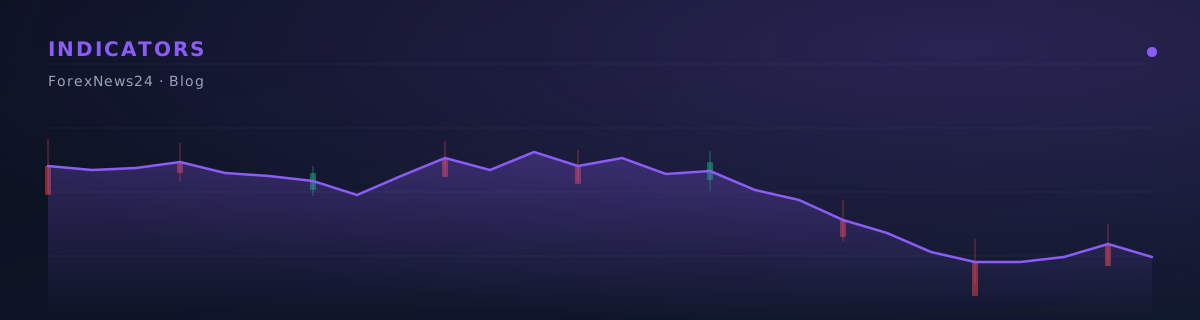
SMA: What the Simple Moving Average Shows
The simple moving average is the arithmetic mean of closing prices over a period. The oldest indicator in technical analysis and the most straightforward: it does not predict, it smooths.
The simple moving average: how SMA is calculated
Every point on the line is the average price of the last N bars, with every bar carrying equal weight. From this follows its main property: SMA responds slowly to price changes and treats new and old data inside the window identically. When an old extreme bar drops out of the window the line jolts — and that jolt has nothing to do with what happened today.
How many signals it produces on real data
- Rule tested: price above SMA(50)
- State changes over the sample: 38 — about 20.1 a year
- Share of bars in the signal state: 53.5%
Measured across 518 daily bars for each of 12 currency pairs. This measures frequency, not profitability: it shows how many decisions the tool demands of a trader. The data is public and the calculation is reproduced by a script in the repository.
How it differs from similar tools
The difference from EMA is in the weights. The exponential average gives more weight to recent prices and turns earlier; the simple one treats every bar in the window alike and lags more. The price of EMA's speed is more false turns in a range. Neither is better: they offer a different trade-off between speed and steadiness.
How to apply it
SMA has two practical uses. As a direction filter: price above a long average means only buys are considered. And as a reference for the zone price returns to in a trend: a pullback to the average allows an entry with a shorter stop than entering mid-move. As a standalone trigger SMA is weak, because price crossing the average happens both in trends and in noise.
Common mistakes
Three common mistakes. Fitting the period to history — a brute-force search always finds a value that handled the past beautifully, which is the definition of overfitting. Using crossovers in a range, where they mean nothing. And treating a touch of the average as support: an average is not a level, no orders have accumulated behind it, and price passes through it without resistance.
This material is for educational purposes and is not individual investment advice.
Frequently asked questions
How is SMA different from EMA?
In bar weights. SMA treats every bar in the window equally and lags more; EMA gives more weight to recent prices and turns earlier — at the cost of more false signals in a range.
Which SMA period should you choose?
Based on your trade horizon, not on a search. The standard 50 and 200 work not because they are optimal but because most participants watch them.
Can you trade on SMA alone?
As a standalone trigger it is weak: price crossing the average happens in trends and in noise alike. Its place is as a direction filter or a reference for entering on a pullback.
New backtest studies — to your inbox
When a new reproducible study comes out or the data is updated, we send a short email. No spam, no "signals", no selling your address.
By leaving your email you agree to receive occasional emails from the portal. Unsubscribe in one click from any of them.